

A simple wardrobe is not a total you have to reach. It is a set you can count, in which most pieces are worn and most go with several others. This guide works in the order you would: count what you own and what you wore, find the pairs you already wear, give the set a colour logic and a shape logic, and write each gap down before anything new comes in.
A simple wardrobe is a set you can count
Here, "simple" means two things you can check on paper: most pieces were worn in the past year, and most combine with several others. Neither depends on a fixed number of pieces.
Counting shows how far apart owned and worn can be. In the United Kingdom, WRAP surveyed more than 6,000 adults in autumn 2021 and reported, on 7 October 2022, "the average person in the UK owning 118 items of clothing", "of which just over a quarter (26%) have not been used in the past year" (WRAP’s report page). The figure takes in every kind of clothing counted, and WRAP’s press release puts the unused share at 31 items.
In Flanders, Belgium, a wardrobe audit of 30 people, published in the PLATE 2025 conference proceedings on 24 June 2025, found that participants "owned, on average, 169 garments, of which 138 were used in the past year (81%)" (the paper’s abstract). What they considered essential varied widely, "ranging from 36 to 275 garments, or alternatively, 28% to 98% of their current wardrobe".
Clothing habits also differ between countries, as a wardrobe survey in China, Germany, Japan, the UK and the USA describes (Laitala and Klepp, 2020). These figures describe two places at two dates, not everyone. They show only that owned and worn can be counted.
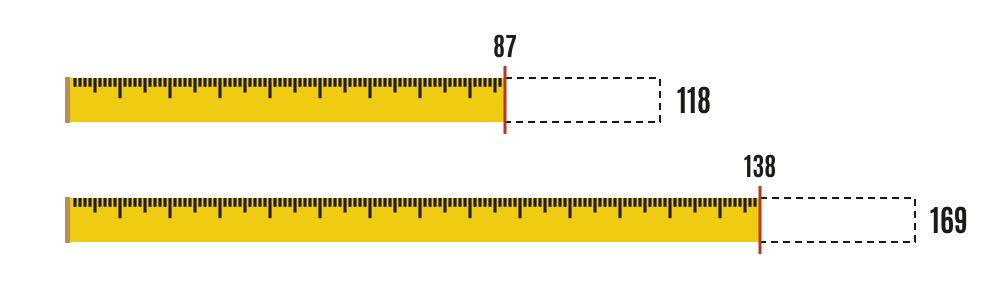
The same figures, with their sources:
| Study | Place, sample, date | Owned on average | Used in the past year | Not used in the past year |
|---|---|---|---|---|
| WRAP survey | United Kingdom, more than 6,000 adults, surveyed in autumn 2021, published 7 October 2022 | 118 | 87 (this website’s subtraction) | 31 (26%) |
| Wardrobe audit | Flanders, Belgium, 30 people, published 24 June 2025 | 169 | 138 (81%) | 31, about 18% (this website’s subtraction) |
Take stock: one sheet, every piece
The stock-take needs one sheet of paper and every piece you wear now. Your warm months and your cool months fall at different times of the year from one place to another, so bring out the pieces for both.
Researchers sort wardrobes in a similar way. A study in Flanders classed each garment as "active" or "dormant" by whether it had been worn in the previous 12 months (project page, December 2025). Another studies the whole wardrobe because that shows "the way in which clothes relate to each other" (Klepp and Bjerck), which is what the sheet looks at too.
- Gather. Take out every piece you wear now, from both of your seasons, and lay the pieces flat, one type at a time.
- List. Write one row per piece: what it is, its type (top, bottom, layer or dress) and its colour group.
- Apply the 12-month test. Mark yes if you wore the piece in the past 12 months, and no if you did not or cannot remember.
- Tally four weeks. For the next four weeks, add a stroke to a row on each day you wear that piece.
- Count links. For each piece, count the other pieces on the sheet that you actually wear with it, as the next section explains.
- Decide. Note each row as centre of the set, needs a partner, or leaves the set.
The inventory sheet holds one row per piece. The four rows below are examples; copy the header and fill in your own.
| Piece | Type | Colour group | Worn in the last 12 months | Tally over four weeks | Combines with (count) | Decision |
|---|---|---|---|---|---|---|
| Example: plain T-shirt | Top | Light | Yes | 6 | 5 | Centre of the set |
| Example: long-sleeved shirt | Top | Light | Yes | 3 | 4 | Centre of the set |
| Example: patterned skirt | Bottom | Dark | Yes | 1 | 1 | Needs a partner |
| Example: lined jacket | Layer | Bright | No | 0 | 0 | Leaves the set |
Find the pieces that already combine
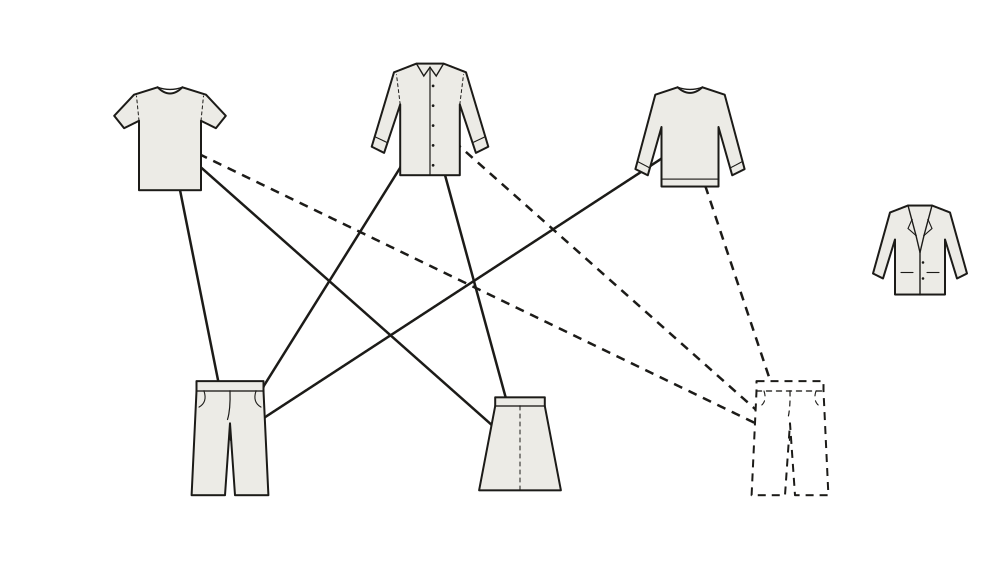
A link is a pair of pieces you actually wear together. A top that you wear with three of your bottoms has three links, and each of those bottoms gains one. Pieces with many links are the centre of the set. A piece with no links is an orphan: nothing else on the sheet goes with it.
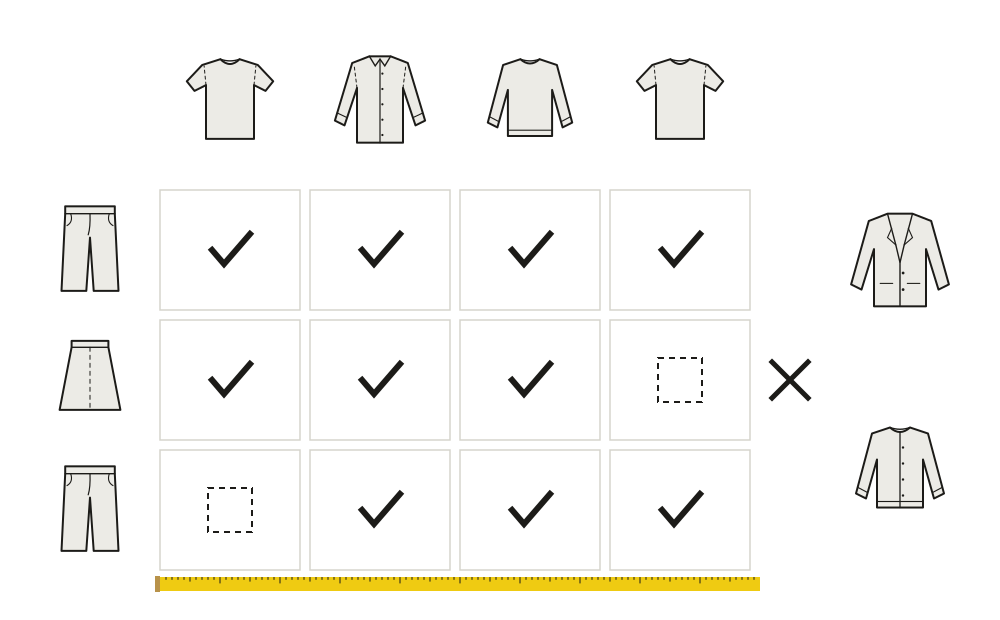
Counting by multiplication is tempting. The multiplication principle says that if one choice can be made in a ways and a second in b ways, the two together can be made in a × b ways (MathWorld, last updated 14 November 2026). Four tops and three bottoms give 12 pairs, and two layers over each pair give 24 combinations. That holds only when every top goes with every bottom.
Why the multiplication overstates it
The multiplication counts every top with every bottom, and every layer with every pair, whether or not you would wear them together. In the grid, 2 of the 12 pairs are empty, and each takes its two layered versions with it, so the total falls from 24 to 20, not to 22. Every pair that does not work removes as many combinations as there are layers. That is why the sheet counts real pairs one by one, and treats the multiplication only as the upper limit.
Give the set a small colour logic
Colour can be handled on the same sheet, without any theory. Sort the rows by colour group and look at the link counts. The two or three groups that hold most of the pieces with high link counts are the base of the set. A piece in any other colour stays if it links with at least three base pieces. One that links with fewer is noted "needs a partner": a gap to write down, not a reason to add more pieces in its colour.
Give it a shape logic, read off the garments
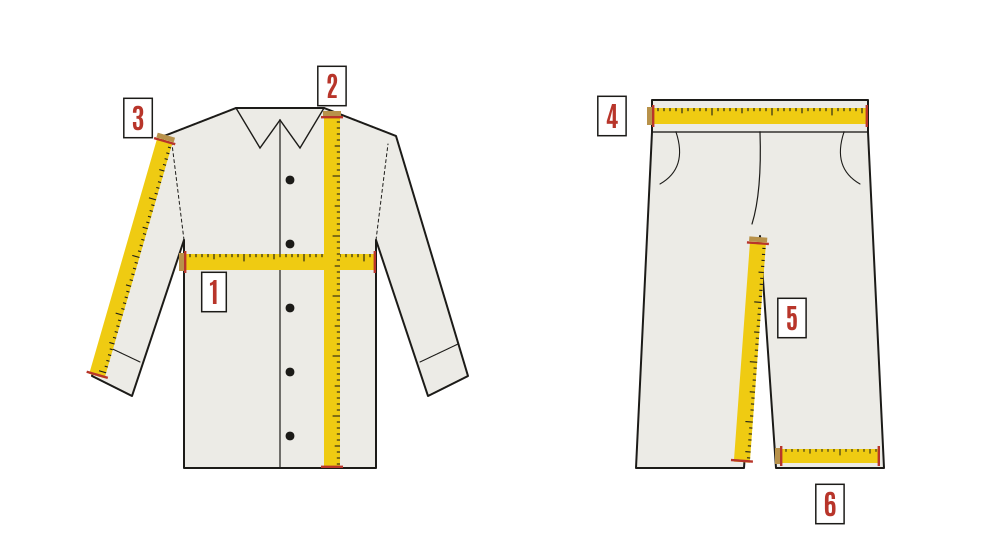
Pieces also combine by proportion, and proportion can be measured on the garments laid flat. For a layer, compare its width straight across, just below the sleeves, with the same width on each top you wear under it; a layer you already wear over a top shows you the margin that works. For a top and a bottom, note the top’s length, from the highest point of the shoulder, where it meets the collar, down to the hem, beside each bottom you wear it with. Write down the width and length of the two or three pieces with the most links. Those numbers are the shape of your set, and a new piece can be compared with them before it joins.
These measuring points are not this website’s idea. The standard ISO 18890:2018 "defines the main measurement points and describes the method used to measure garment dimensions" (ISO catalogue page, published April 2018, last reviewed and confirmed in 2024). One seller’s measuring page takes the width of a top laid flat at the seam below the sleeves, "edge-to-edge rather than seam-to-seam". A second maker’s guide for tops takes it about 2.5 cm / 1 in lower, says "The measurements begin and end at the fabric, not the seams", and takes the sleeve from the shoulder seam "all the way to the end of the cuff" (both seen 16 November 2026).
Fill the gaps on purpose
A gap is a combination you keep wanting and cannot make from the sheet. Write it down as a specification before you look at any shop: its type, its colour group, the pieces it must link with (at least three, each named) and its target measurements.
The target measurements come from a garment of the same type that you own, wear often and like the shape of. A third maker’s fit guide asks you to lay it flat "without stretching the fabric" (seen 16 November 2026). Measure it at the points the seller’s size guide uses, write both sets of figures on the measurement sheet, and first check three things on the seller’s page:
- whether the chart gives the garment’s own measurements laid flat, so that you compare garment with garment;
- whether a width is given flat or doubled;
- where exactly the width and the length are taken, since the two measuring pages above place the width differently.
The measurement sheet puts your garment beside the seller’s figure, one row per measuring point; the difference is the seller’s figure minus yours. Every value in it is an example.
| Measurement | Where on the garment laid flat | Your garment (example) | Seller’s size guide (example) | Difference (example) |
|---|---|---|---|---|
| Width | Straight across, just below the sleeves | 56 cm / 22 in | 57 cm / 22.4 in | +1 cm / +0.4 in |
| Length | From the highest point of the shoulder, where it meets the collar, down to the hem | 74 cm / 29.1 in | 73 cm / 28.7 in | −1 cm / −0.4 in |
| Sleeve | From the shoulder seam to the end of the cuff | 64 cm / 25.2 in | 64 cm / 25.2 in | 0 |
| Waistband | From edge to edge | 41 cm / 16.1 in | 40 cm / 15.7 in | −1 cm / −0.4 in |
| Inside leg seam | From where the two leg seams meet down to the hem | 79 cm / 31.1 in | 81 cm / 31.9 in | +2 cm / +0.8 in |
| Leg opening | Straight across the hem | 19 cm / 7.5 in | 19 cm / 7.5 in | 0 |
Add one planned piece at a time. Once you have worn it, give it a row on the inventory sheet and count its links.
Keep the set small
Three rules keep the sheet current, and each one can be counted:
- A new piece enters only with a written gap behind it and at least three links ahead of it.
- Redo the sheet when your warm months end and your cool months begin, and again when they change back.
- A piece that has not been worn in 12 months and has no links leaves the set: pass it on.
A gap written down, three links named, then one piece.
What varies, and where to check it
- What a chart describes. Some charts give the garment’s own measurements laid flat and some do not; the chart’s note says which.
- Flat or doubled. One seller doubles some widths and not others; the note beside the chart says which.
- Where the width is taken. At the seam below the sleeve, or about 2.5 cm / 1 in lower; the seller’s diagram shows it.
- Units. Centimetres or inches; 1 in = 2.54 cm.
- Size labels. The same letter or number can describe different garments from one maker to another, and from one country’s range to another’s. Read the chart on that product’s own page, on the seller’s page for your country.
- Allowance. A finished garment can differ a little from its chart; the seller’s size guide states its own allowance, if it gives one.
- Care. The maker sets it for each garment and shows it on the garment’s own care label; GINETEX lists the symbols.
- How many pieces are enough. Neither definition above gives a number, and in the Flanders audit the essential share ran from 28% to 98%. Your own sheet is the measure.
How this website chooses and checks its sources is set out in its editorial policy.